Value of exports fell by four per cent in 2016 - Significant increase in the trade deficit
Annual Publication: preliminary data
According to Finnish Customs’ preliminary data, the value of Finland’s goods exports declined by four per cent in 2016. The value of exports amounted to 51.7 billion euros. The value of imports, on the other hand, remained almost level with the year before and amounted to 54.6 billion euros. In 2015, the exports also decreased by four per cent, but the imports went down by six per cent.
Compared to recent years, there was a significant increase in the trade deficit last year. According to preliminary data, the trade balance showed a deficit of 2.9 billion euros in 2016. The deficit was the largest since 2011, when the trade deficit amounted to 3.7 billion euros. The deficit in the trade with EU countries increased to more than 3.3 billion euros last year. In the trade with non-EU countries, however, there was a surplus of 415 million euros. In 2015, the trade deficit was only 613 million euros, the trade with EU countries showed a deficit of 2.3 billion euros, but the trade with non-EU countries was in surplus by 1.7 billion euros. The deficit in 2014 amounted to almost 1.8 billion euros. Then, the extra-EU trade deficit amounted to 70 million euros and that of EU trade to 1.7 billion euros.
Exports were lagging in almost all the main sectors in 2016. Exports of forest industry products were almost level with the previous year, but exports of machinery decreased. Exports of transport equipment saw the steepest decline of the main sectors, but there was also a considerable drop in exports of metal industry products. By contrast, the value of exports of oil products saw a moderate rise, while exports from the rest of the chemical industry went down. Exports of instruments and meters, and of mobile technology networking equipment, performed positively. Finnish Customs will publish detailed country and goods statistics on the foreign trade in goods for the whole of last year on 28 February 2017.
Last year, total imports remained at the same level as the previous year. In 2016, imports of capital goods grew strongly. The biggest rise was seen in imports of transport equipment, while imports of consumer goods also went up. On the other hand, there was a decline in imports of energy products and intermediate goods.
Export trade with the EU countries decreased by four per cent in 2016. Exports to the Eurozone also fell by four per cent. Exports to non-EU countries shrank by five per cent. In 2015, exports to EU countries decreased by one per cent, while exports to non-EU countries decreased by eight per cent. In 2016, imports from all EU countries were at the same level as the year before. In 2015, imports from EU countries increased by one per cent. Imports from non-EU countries increased by one per cent in 2016. In 2015, imports in extra-EU trade went down by 15 per cent.
Overall development, million euros (the figures for 2016 are based on preliminary statistics)

Figure 1. Exports, imports and trade balance in Finland by month 2014–2016, million euros - See annex
Figure 2. Exports, imports and trade balance in Finland by year 1990–2016, billion euros - See annex
Forest industry had greatest share of total exports
The share of forest industry products of total exports increased to 22 per cent last year when calculated on the figures for January–November. It was once again our largest export sector. The share of the machinery and vehicles industry decreased somewhat last year, while still remaining the second largest export sector. The share of the chemical industry rose slightly last year, being almost level with the machinery and vehicles industry with a share of almost one fifth. The share of the metal industry was almost 15 per cent and the share of the electric and electronics industry was 12 per cent. However, the changes were very small compared to the year before.
Figure 3. Different industrial sectors’ (CPA) share of Finland’s total exports 2000–2016 (1–11), per cent - See annex
Exports were lagging in almost all the main sectors last year
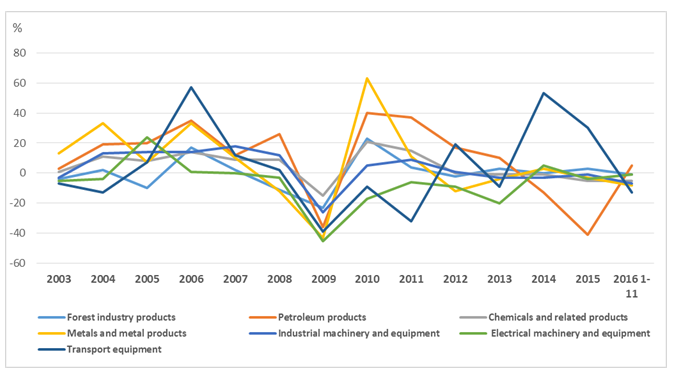
Total exports from the forest industry sector remained at almost the same level as the previous year with a drop of one per cent in January–November 2016. In 2015, exports of forest industry products grew by three per cent. Last year, exports from the mechanical forest industry went up, but exports of paper and pulp decreased.
Exports of machinery and transport equipment took a downward turn in January–November last year with a drop of seven per cent. Exports of industrial machinery and equipment also went down by seven per cent, and exports of transport equipment by 13 per cent. Transport equipment had been the biggest growth sector for exports in the previous two years. Exports of motor vehicles took a significant downturn last year, but the value of exports of vessels was three per cent higher than in 2015. Exports of electrical machinery and equipment stayed more or less level with the year before.
In January–November 2016, the value of exports of oil products took an upward turn of five per cent. The year before, the value of exports of oil products had fallen by 42 per cent, due to a decrease in both export prices and export volumes. The export prices of oil products went down by one fifth in January–November last year, but at the same time, export volumes rose by almost 32 per cent compared to the corresponding period in 2015. The share of oil products of total exports went up from 6.4 per cent in 2015 to 7.2 per cent. By contrast, exports of other chemical industry products saw a moderate decline last year compared to the previous year.
The total exports of metal industry products fell by eight per cent in January–November 2016. Exports of iron and steel declined the most.
Among the few growth sectors in exports last year, apart from oil products, were instruments and meters, metalliferous ores and metal scrap, as well as mobile technology networking equipment.
As regards total imports, the main factor driving an increase was the growth in imports of capital goods. The total imports of machinery and transport equipment increased by six per cent in January–November. The value of imports of energy products went down by more than one tenth overall. Based on the figures for January–November, the import prices of crude oil went down by almost one fifth, but since the import volumes went up by more than one tenth, the value of crude oil imports decreased by ten per cent. Similarly, the import prices for oil products also fell, by more than a quarter, but the import volumes went up by 15 per cent. Imports of intermediate goods declined slightly last year. Imports of consumer goods, on the other hand, went up last year.
Figure 4. Change in exports of main export sectors 2003–2016 (1-11), per cent. - See annex
EU countries’ share of Finland’s exportsover 59 per cent
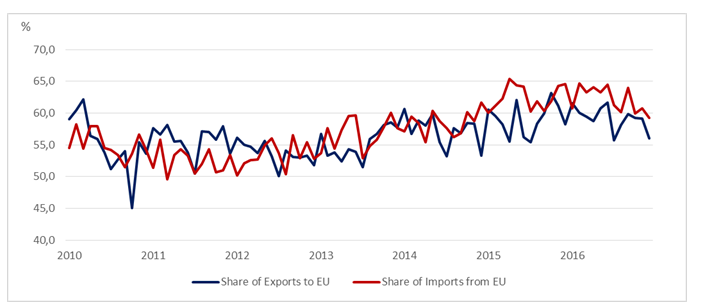
The EU countries’ share of Finland’s exports grew slightly in 2016, from 59.0 per cent in the previous year to 59.2 per cent. As for imports, the EU countries’ share decreased slightly, from 62.6 per cent in the previous year to 62.2 per cent.
The shares in the trade with countries outside the EU changed correspondingly. Last year, the extra-EU trade had a 40.8 per cent share of exports and a 37.8 per cent share of imports, while the corresponding shares for the previous year were 41.0 per cent of exports and 37.4 per cent of imports.
Figure 5. Share of EU exports and EU imports of Finland’s total foreign trade 2010–2016 by month. - See annex
Note: scale of vertical axis begins at 40 per cent.
Germany was still our biggest trading partner
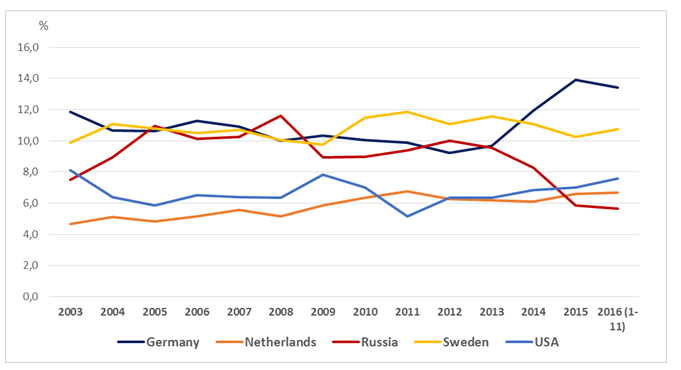
Sweden was for many years our biggest export country and Russia our biggest trading partner when measured by total trade volume. There was a change in this order in 2014. Germany rose to become both our biggest export country and our biggest trading partner. Germany retained this position in 2016, although its share of total exports went down by 0.5 percentage points, amounting to 13.4 per cent based on the figures for January–November. Sweden was once again our second biggest export country, with a share of 10.7 per cent, and also our second biggest trading partner. The United States kept its position as our third biggest export country with a share of 7.6 per cent, and the Netherlands was fourth biggest (6.7%). Russia was still the fifth biggest export country with a share that diminished to 5.7 per cent last year, compared to 5.9 per cent the year before. In 2014, the share had been 9.8 per cent.
Russia was our biggest import country from 2003 to 2015, when the country dropped to third biggest import country with a share of 11 per cent. In 2014, Russia’s share of total imports was almost 15 per cent, and as high as 18 per cent in 2013. Russia was still the third biggest import country in January–November last year, with a share of 10.9 per cent. Germany remained our biggest import country with a share of 15 per cent of total imports. Sweden was second with a share of 11.3 per cent. China was the fourth biggest import country with a share of 7.5 per cent, and the Netherlands was fifth with a 6.1 per cent share in January–November last year. When measured by total trade volume, China was our fifth biggest, Netherlands our fourth biggest and Russia third biggest trading partner.
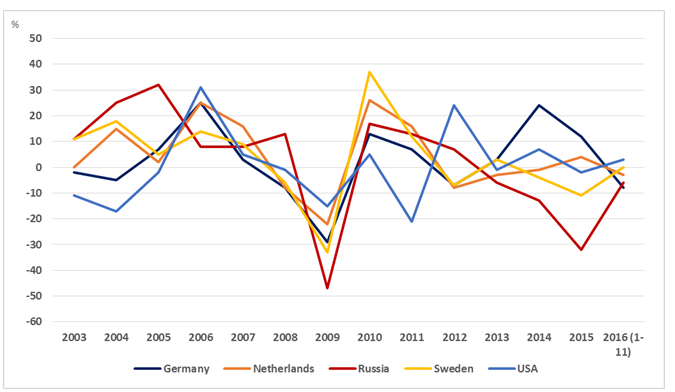
Figure 6. Share of total Finnish exports of Germany, the Netherlands, the United States, Russia and Sweden
2003–2016 (1–11), per cent. - See annex
Exports to Germany fell by eight per cent in January–November last year, while exports to Sweden remained at the same level as over the corresponding period the previous year. Exports to the United States grew by three per cent over the corresponding period, whereas exports to the Netherlands decreased by three per cent. Exports to Russia fell by six per cent in January–November last year. Finnish Customs will publish country-specific data on foreign trade for the whole of 2016 on 28 February 2017.
Imports from Russia decreased by one per cent in January–November last year. Imports from Sweden went down by two per cent over the same period. Similarly, imports from Germany also decreased by two per cent. Imports from the United States stayed level with the previous year, whereas imports from the Netherlands decreased by seven per cent. Imports from China went up by two per cent while imports from France, the sixth biggest import country, went up by as much as 27 per cent.
Figure 7. Change in Finland’s exports to Germany, the Netherlands, the United States, Russia and Sweden
2003–2016 (1–11), per cent. - See annex
Development of EU countries’ exports in 2016
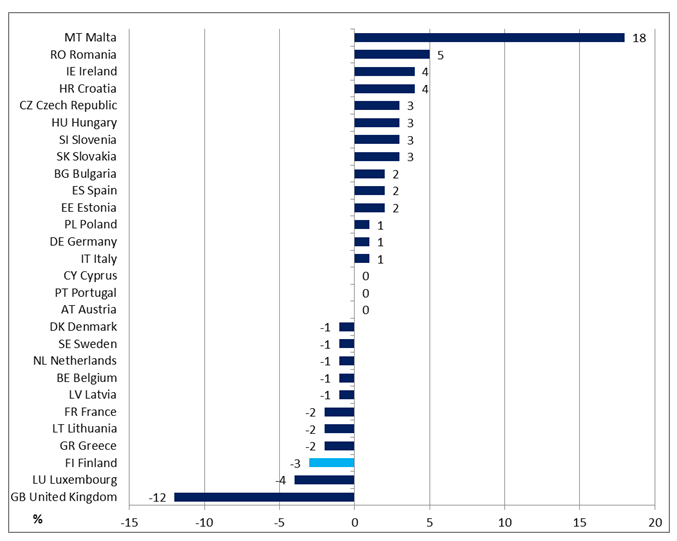
The combined exports of the EU countries (EU28) shrank by one per cent in 2016 (January–October).[1] Finnish exports, based on the EU definition of exports, went down by three per cent over the corresponding period. Finland’s exports showed the third weakest trend of the EU countries last year (January–November). Only Luxembourg (-4%) and the United Kingdom (-12%) had a bigger drop in exports than Finland. Exports were in decline or level with the previous year in 14 EU countries. In addition, growth was very modest (1–2%) in six EU countries.
Exports grew the most in Malta, Romania and Ireland. Among Finland’s major trading partners, Sweden’s exports decreased by one per cent, as did Netherland’s exports. Germany’s exports grew by one per cent, but France’s exports went down by two per cent. Exports went up by two per cent in Spain and down by one per cent in Belgium.
Figure 8. Change in exports in different EU countries in 2016 (01–11), per cent - See annex
[1] Source: Eurostat Comext database, latest figures are from January-October.
Source: Eurostat news release 9/2017
The fall in the trade with Russia was more moderate in 2016
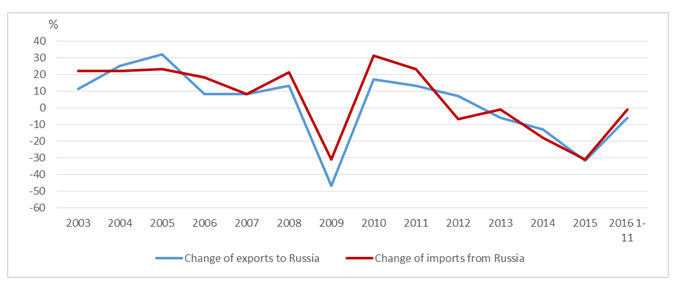
There was a slump in the growth of exports to Russia already in 2011, even though the following year still saw a growth of seven per cent. The decline in exports to Russia started in 2013 with a downturn of six per cent. In 2014, the decrease in export was already 13 per cent, and in 2015, exports plummeted by 32 per cent. The fall in exports in 2015 did not, however, reach the level of the crisis year 2009, when exports dropped by 47 per cent. In January–November 2016, the fall in exports was more moderate, six per cent. There was a decrease in exports to Russia in almost all the main product groups, but the drop was more moderate compared to the year before. Exports of oil products went up by one per cent, and exports of instruments and meters by six per cent. Exports of metalliferous ores and metal scrap grew the most. Of the main sectors, exports of chemicals and related products showed the biggest decline. Exports of forest industry products as well as machinery and transport equipment also fell slightly.
The growth in imports from Russia took a negative turn already in 2012, when imports fell by seven per cent. The following year, imports declined moderately, diminishing by one per cent, but in 2014, the decline was already at 18 per cent. In 2015, imports also plummeted, by 31 per cent. This was as much as in 2009, which was the previous year when imports fell drastically. In January–November 2016, imports declined by only one per cent. In January–November last year, 71 per cent of imports from Russia were energy products, and almost 82 per cent of this was made up of oil products. The import prices of crude oil from Russia fell by less than 20 per cent last year, and as import volumes increased by almost as much as the prices went down, the value of imports of crude oil fell by only four per cent. There was also a decline in imports of gas, whereas imports of electricity and coal went up. There was an increase in imports of metals and metal products and of machinery and transport equipment. Imports of forest industry products also grew, albeit moderately.
The combined exports from the EU countries to Russia fell by two per cent in January–November last year, while imports from Russia fell by 16 per cent.[1] That is, Finnish exports to Russia declined by more than the average for exports from all the EU countries. However, in imports, the EU combined figure fell significantly more compared with Finland’s imports.
Figure 9. Change in exports to Russia and in imports from Russia, 2003–2016 (1–11), per cent - See annex
Transit transports
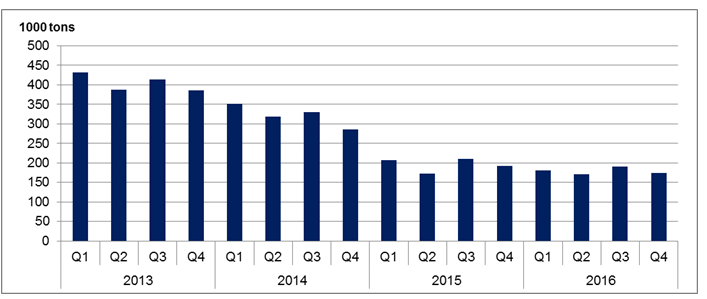
According to Finnish Customs’ statistics on transit transports, 714 thousand tons of transit goods were exported as transit transports from Finland to Russia in 2016. The number of transit tons fell by almost nine per cent compared to the previous year. The drop in transit transports, however, was considerably less steep compared to the dramatic slump of 39 per cent in 2015. The transit transport volumes have been shrinking every year since 2011. The transit statistics contain information on road transports transited through Finland and across the Finnish-Russian border through the most important border crossing points. The transit goods arrive at the customs border of Finland, from where they are transited by road to Russia without customs clearance in the customs territory of Finland. The goods contained in the road transit statistics are not included in Finland’s foreign trade statistics.
Figure 10. Transit transports 2013–2016 (1000 tons), by quarter - See annex
[2] Source: Eurostat news release 9/2017
Border traffic
Finnish Customs’ statistics on border traffic indicate the volumes of Finland’s border traffic according to vehicle type and border crossing point. The total border traffic volumes in Finland grew by 0.5 per cent in January–November last year. The traffic volumes via the border crossing points on the Finnish-Russian border fell by four per cent, whereas the traffic volumes via the other border crossing points went up by more than one per cent. Border traffic volumes through Helsinki border crossing point saw a rise of six per cent.
Figure 11. Border traffic at Helsinki, the Finnish-Russian border and the other border crossing points
2008–2016 (1–11), thousand vehicles - See annex


Tietoa julkaisijasta
Finnish Customs is a part of the customs system of the European Union. Customs is a state agency supervised by the Ministry of Finance through management by results. Finnish Customs cooperates with the trade community as well as with domestic and foreign authorities. Finnish Customs has approximately 2 200 employees.


