UPS REPORTS 2Q EPS OF $1.58 AS REVENUE GROWS ACROSS ALL SEGMENTS
Contacts:
Steve Gaut, Public Relations
+1 404-828-8787
Scott Childress, Investor Relations
+1 404-828-7957
- U.S. Domestic Operating Profit Jumps 13% and Margin Expands to 14.3%
- U.S. Domestic Revenue up 8.1% on Strong Air & Ground Product Growth
- Export Shipments Rise 12% with Gains from all International Regions
- International Revenue up 2.8%, Currency-Neutral Revenue* 8.3% Higher
- All Supply Chain & Freight Units Contribute to 12% Revenue Increase
- Company Reiterates Full-Year 2017 Adjusted EPS Guidance
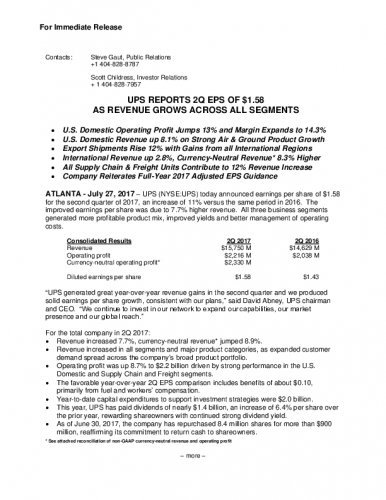
ATLANTA - July 27, 2017 – UPS (NYSE:UPS) today announced earnings per share of $1.58 for the second quarter of 2017, an increase of 11% versus the same period in 2016. The improved earnings per share was due to 7.7% higher revenue. All three business segments generated more profitable product mix, improved yields and better management of operating costs.
|
Consolidated Results |
2Q 2017 |
2Q 2016 |
|
Revenue |
$15,750 M |
$14,629 M |
|
Operating profit |
$2,216 M |
$2,038 M |
|
Currency-neutral operating profit* |
$2,330 M |
|
|
|
|
|
|
Diluted earnings per share |
$1.58 |
$1.43 |
“UPS generated great year-over-year revenue gains in the second quarter and we produced solid earnings per share growth, consistent with our plans,” said David Abney, UPS chairman and CEO. “We continue to invest in our network to expand our capabilities, our market presence and our global reach.”
For the total company in 2Q 2017:
- Revenue increased 7.7%, currency-neutral revenue* jumped 8.9%.
- Revenue increased in all segments and major product categories, as expanded customer demand spread across the company’s broad product portfolio.
- Operating profit was up 8.7% to $2.2 billion driven by strong performance in the U.S. Domestic and Supply Chain and Freight segments.
- The favorable year-over-year 2Q EPS comparison includes benefits of about $0.10, primarily from fuel and workers’ compensation.
- Year-to-date capital expenditures to support investment strategies were $2.0 billion.
- This year, UPS has paid dividends of nearly $1.4 billion, an increase of 6.4% per share over the prior year, rewarding shareowners with continued strong dividend yield.
- As of June 30, 2017, the company has repurchased 8.4 million shares for more than $900 million, reaffirming its commitment to return cash to shareowners.
* See attached reconciliation of non-GAAP currency-neutral revenue and operating profit
U.S. Domestic Segment
The Domestic segment benefitted from growing demand for ecommerce deliveries, which fueled an 8.1% increase in revenue over 2Q 2016. The U.S. consumer increasingly prefers to shop online and UPS is taking advantage of this trend through its unique portfolio of delivery solutions and industry-leading customer-facing technology.
|
|
2Q 2017 |
2Q 2016 |
|
Revenue |
$9,745 M |
$9,015 M |
|
Operating profit |
$1,395 M |
$1,233 M |
For the U.S. Domestic segment in 2Q 2017:
- Revenue improved $730 million over 2Q 2016 as ecommerce drove higher demand for UPS Air and Ground products.
- Next Day Air and Deferred Air shipments climbed 6.4% and 11% respectively, as customers continued to select UPS’s quick and convenient solutions.
- Revenue per piece increased solidly across all products and was up 3.0% in total, as the company benefited from base-rate pricing actions and higher fuel surcharges versus 2Q 2016.
- Operating profit increased more than 13% and operating margin expanded 60 basis points to 14.3%.
- Operating costs for ongoing initiatives including facility construction and Saturday operations increased costs by about $35 million.
International Segment
The International segment generated solid top-line improvement with increased demand for cross-border shipments. Export shipments grew across all UPS regions, as customers took advantage of UPS’s expanded portfolio, improved time-in-transit and industry-leading customs brokerage solutions. The International segment also made several announcements to expand its capacity and local-market presence.
|
|
2Q 2017 |
2Q 2016 |
|
Revenue |
$3,163 M |
$3,077 M |
|
Operating profit |
$583 M |
$613 M |
|
Currency-neutral operating profit* |
$697 M |
|
For the International segment in 2Q 2017:
- Operating margin was industry leading at 18.4%, and operating profit was $583 million, including anticipated currency headwinds of $114 million.
- Robust export growth continued at 12% led by Europe and Asia. All regions of the world contributed to the expansion.
- The segment reported a revenue increase of 2.8% over 2Q 2016, up 8.3% on a currency-neutral* basis.
- During the quarter, UPS announced an exclusive partnership with Expo 2020 Dubai, created an innovative alliance with S.F. Express – a market-leading Chinese logistics company, and acquired Nightline Logistics, which solidified local market leadership in Ireland.
* See attached reconciliation of non-GAAP currency-neutral revenue and operating profit
Supply Chain and Freight Segment
“The Supply Chain and Freight segment again showed good momentum this quarter as the teams in each business unit are executing on revenue quality improvements combined with structural cost reduction programs,” Abney said. “This performance shows balanced improvement across all business units as revenue and operating cost initiatives strengthen core performance.”
|
|
2Q 2017 |
2Q 2016 |
|
Revenue |
$2,842 M |
$2,537 M |
|
Operating profit |
$238 M |
$192 M |
- Revenue increased 12% over 2Q 2016 as the company deeply aligned with preferred customers, strengthened revenue management initiatives and market conditions improved across all business units.
- Tonnage gains in Freight Forwarding and UPS Freight contributed to improved top-line results as economic conditions across non-retail markets continue to strengthen.
- Retail inventory replenishment and improved aerospace sector performance enhanced the Distribution unit results.
- Coyote Logistics delivered double-digit revenue growth as the unit continued to gain market share.
- All business units contributed to segment operating profit expansion of 24%, which included a one-time benefit.
Outlook
The company provides guidance on an adjusted (non-GAAP) basis because it is not possible to predict or provide a reconciliation reflecting the impact of future pension mark-to-market adjustments, which would be included in reported (GAAP) results and could be material.
“Second quarter results were in line with our expectations and we are pleased with the progress on our strategic initiatives,” said Richard Peretz, UPS chief financial officer. “Looking at the second half of the year, our core business performance will continue to produce solid results.”
The company’s full-year 2017 adjusted earnings per share guidance includes the following:
- Second half currency headwinds and continued costs for strategic initiatives will weigh on results.
- One less operating day in 3Q 2017 compared to 3Q 2016 will contribute to relatively flat diluted earnings per share (EPS) growth.
- The tax rate is expected to be 35% for the second half of 2017 and excludes 4Q 2016 tax savings of approximately $0.05 per share.
UPS reaffirms 2017 adjusted diluted EPS guidance to be between $5.80 and $6.10, which includes about $400 million, or $0.30 per share of pre-tax currency headwinds.
# # #
Conference Call Information
UPS CEO David Abney and CFO Richard Peretz will discuss second-quarter results with investors and analysts during a conference call at 8:30 a.m. EST, July 27, 2017. That call is open to others through a live Webcast. To access the call, go to www.investors.ups.comand click on “Earnings Webcast.”
About UPS
UPS (NYSE: UPS) is a global leader in logistics, offering a broad range of solutions including transporting packages and freight; facilitating international trade, and deploying advanced technology to more efficiently manage the world of business. Headquartered in Atlanta, USA, UPS serves more than 220 countries and territories worldwide. The company can be found on the web at ups.com orpressroom.ups.com and its corporate blog can be found at longitudes.ups.com. To get UPS news direct, follow @UPS_News on Twitter.
Forward-Looking Statements
Except for historical information contained herein, the statements made in this release constitute forward-looking statements within the meaning of Section 27A of the Securities Act of 1933 and Section 21E of the Securities Exchange Act of 1934. Such forward-looking statements, including statements regarding the intent, belief or current expectations of UPS and its management regarding the company's strategic directions, prospects and future results, involve certain risks and uncertainties.
Reconciliation of GAAP and non-GAAP Financial Measures
We supplement the reporting of our financial information determined under generally accepted accounting principles ("GAAP") with certain non-GAAP financial measures, including, as applicable, "as adjusted" operating profit, operating margin, pre-tax income, net income and earnings per share. The equivalent measures determined in accordance with GAAP are also referred to as "reported" or "unadjusted.” Additionally, we periodically disclose free cash flow as well as currency-neutral revenue, revenue per piece and operating profit.
We believe that these non-GAAP measures provide additional meaningful information to assist users of our financial statements in understanding our financial results and assessing our ongoing performance because they exclude items that may not be indicative of, or are unrelated to, our underlying operations and may provide a useful baseline for analyzing trends in our underlying businesses. Management uses these non-GAAP financial measures in making financial, operating and planning decisions. We also use certain of these measures for the determination of incentive compensation award results.
Non-GAAP financial measures should be considered in addition to, and not as an alternative for, our reported results prepared in accordance with GAAP. Our non-GAAP financial information does not represent a comprehensive basis of accounting. Therefore, our non-GAAP financial information may not be comparable to similarly titled measures reported by other companies.
Currency-Neutral Revenue, Revenue per Piece and Operating Profit
We supplement the reporting of our revenue, revenue per piece and operating profit with similar non-GAAP measures that exclude the period-over-period impact of foreign currency exchange rate changes and hedging activities. We believe currency-neutral revenue, revenue per piece and operating profit information allows users of our financial statements to understand growth trends in our products and results. We evaluate the performance of our International Package and Supply Chain and Freight businesses on a currency-neutral basis.
Currency-neutral revenue, revenue per piece and operating profit are calculated by dividing current period reported U.S. dollar revenue, revenue per piece and operating profit by the current period average exchange rates to derive current period local currency revenue, revenue per piece and operating profit. The derived current period local currency revenue, revenue per piece and operating profit are then multiplied by the average foreign exchange rates used to translate the comparable results for each month in the prior year period (including the period over period impact of foreign currency revenue hedging activities). The difference between the current period reported U.S. dollar revenue, revenue per piece and operating profit and the derived current period U.S. dollar revenue, revenue per piece and operating profit is the period over period impact of currency fluctuations.
Reconciliation of GAAP and non-GAAP Revenue, Revenue Per Piece and Operating Profit
(in millions, except Per Piece amounts):
|
Three Months Ended June 30 |
||||||||
|
|
|
|
|
|
||||
|
|
2017 As-Reported (GAAP) |
2016 As-Reported (GAAP) |
% Change (GAAP) |
Currency Impact |
2017 Currency-Neutral (non-GAAP) |
% Change (non-GAAP) |
||
|
Average Revenue Per Piece: |
|
|
|
|
|
|
||
|
International Package: |
|
|
|
|
|
|
||
|
Domestic |
$ 5.99 |
$ 6.07 |
-1.3% |
$ 0.36 |
$ 6.35 |
4.6% |
||
|
Export |
29.22 |
31.36 |
-6.8% |
1.60 |
30.82 |
-1.7% |
||
|
Total International Package |
16.31 |
16.70 |
-2.3% |
0.91 |
17.22 |
3.1% |
||
|
|
|
|
|
|
|
|
||
|
Consolidated |
$ 10.75 |
$ 10.57 |
1.7% |
$ 0.15 |
$ 10.90 |
3.1% |
||
|
|
|
|
|
|
|
|
||
|
Revenue: |
|
|
|
|
|
|
||
|
U.S. Domestic Package |
$ 9,745 |
$ 9,015 |
8.1% |
$ - |
$ 9,745 |
8.1% |
||
|
International Package |
3,163 |
3,077 |
2.8% |
170 |
3,333 |
8.3% |
||
|
Supply Chain & Freight |
2,842 |
2,537 |
12.0% |
14 |
2,856 |
12.6% |
||
|
Total revenue |
$15,750 |
$14,629 |
7.7% |
$ 184 |
$15,934 |
8.9% |
||
|
|
|
|
|
|
|
|
||
|
Operating Profit: |
|
|
|
|
|
|
||
|
U.S. Domestic Package |
$ 1,395 |
$ 1,233 |
13.1% |
$ - |
$ 1,395 |
13.1% |
||
|
International Package |
583 |
613 |
-4.9% |
114 |
697 |
13.7% |
||
|
Supply Chain & Freight |
238 |
192 |
24.0% |
- |
238 |
24.0% |
||
|
Total operating profit |
$ 2,216 |
$ 2,038 |
8.7% |
$ 114 |
$ 2,330 |
14.3% |
||
|
|
|
|
|
|
|
|
||
|
|
|
|
|
|
|
|||
|
Six Months Ended June 30 |
||||||||
|
|
|
|
|
|
||||
|
|
2017 As-Reported (GAAP) |
2016 As-Reported (GAAP) |
% Change (GAAP) |
Currency Impact |
2017 Currency-Neutral (non-GAAP) |
% Change (non-GAAP) |
||
|
Average Revenue Per Piece: |
|
|
|
|
|
|
||
|
International Package: |
|
|
|
|
|
|
||
|
Domestic |
$ 5.85 |
$ 5.99 |
-2.3% |
$ 0.32 |
$ 6.17 |
3.0% |
||
|
Export |
28.67 |
30.90 |
-7.2% |
1.63 |
30.30 |
-1.9% |
||
|
Total International Package |
15.88 |
16.54 |
-4.0% |
0.90 |
16.78 |
1.5% |
||
|
|
|
|
|
|
|
|
||
|
Consolidated |
$ 10.63 |
$ 10.48 |
1.4% |
$ 0.15 |
$ 10.78 |
2.9% |
||
|
|
|
|
|
|
|
|
||
|
Revenue: |
|
|
|
|
|
|
||
|
U.S. Domestic Package |
$ 19,280 |
$ 18,099 |
6.5% |
$ - |
$ 19,280 |
6.5% |
||
|
International Package |
6,221 |
5,991 |
3.8% |
340 |
6,561 |
9.5% |
||
|
Supply Chain & Freight |
5,564 |
4,957 |
12.2% |
24 |
5,588 |
12.7% |
||
|
Total revenue |
$ 31,065 |
$ 29,047 |
6.9% |
$ 364 |
$ 31,429 |
8.2% |
||
|
|
|
|
|
|
|
|
||
|
Operating Profit: |
|
|
|
|
|
|
||
|
U.S. Domestic Package |
$ 2,471 |
$ 2,335 |
5.8% |
$ - |
$ 2,471 |
5.8% |
||
|
International Package |
1,112 |
1,187 |
-6.3% |
233 |
1,345 |
13.3% |
||
|
Supply Chain & Freight |
417 |
339 |
23.0% |
1 |
418 |
23.3% |
||
|
Total operating profit |
$ 4,000 |
$ 3,861 |
3.6% |
$ 234 |
$ 4,234 |
9.7% |
||
|
|
|
|
|
|
|
|
||